KDPC-101

Product Code:KDPC-106
PROCESS CONTROL & INSTRUMENTATION LAB
Engineering and educational laboratory equipment from K. D. Engineers.
PRODUCT DETAILS
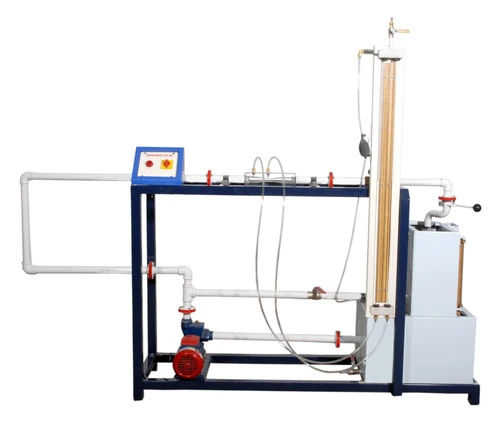
The setup consists of a process tank fitted with scale inwhich water enters through a Pneumatic control valve.Water is pumped to process tank from the sump tank bymeans of a centrifugal pump. The level transmitter is fitted inthe process tank. The level of water in process tank issensed by the transmitter and communicated to the digitalindicating controller. This measured variable is comparedwith the Set Point by controller and output is generated andgiven to I/P converter, which in turn supply the 3-15 Psigpressure to vary the opening of the Pneumatic control valveto eliminate the error observed. As the opening ofpneumatic control valve varies, the level in the Process Tankgets affected. This process goes on until the Set Point targetis achieved. A rotameter is also provided at the drain line ofthe process tank to disturb the system and to observe theeffect of disturbance. The drain and overflow of the processtanks returns in the sump tank, hence the system operates inclose circuit. These units along with necessary piping aresupported in a well-designed housing and are fixed on baseplate. The process parameter is controlled through computerby micro-processor Controller (SCADA Model) bymanipulating water flow to the process tank.The present set-up is completely computerized controlled.The Digital Indicating Controller have a facility to interfacethe system with computer which enables to change the PIDparameters using computer. The educational software anddata-logging package has been developed for unit. Thesoftware environment base is of Labview of NATIONALINSTRUMENTS, USA. This software is compatible tointerfacing unit. This softwarepackage provides a comprehensive educational softwareenvironment within which the PID investigations can beperformed. This software is capable to tabulate the samplereadings according to the requirement of experiment understudy and results obtained can be compared. The real timedata acquisition can be done by interfacing the set-up withcomputer using software. This software can be used outsidethe laboratory with the computer to familiarize the studentswith the equipment and procedures with the help of Flow Diagrams provided in the software. In flow diagrams Set Point, Process Variable and Controllers Output are visible onthe screen and this data can be transferred in Excel Files forfurther calculations, plotting graphs etc. When real time dataacquisition is done, display of SV, PV and Output is there onthe screen. It also appears in graphical display. Softwareallows the user to have control on sampling time, datalogging, printing the stored data.